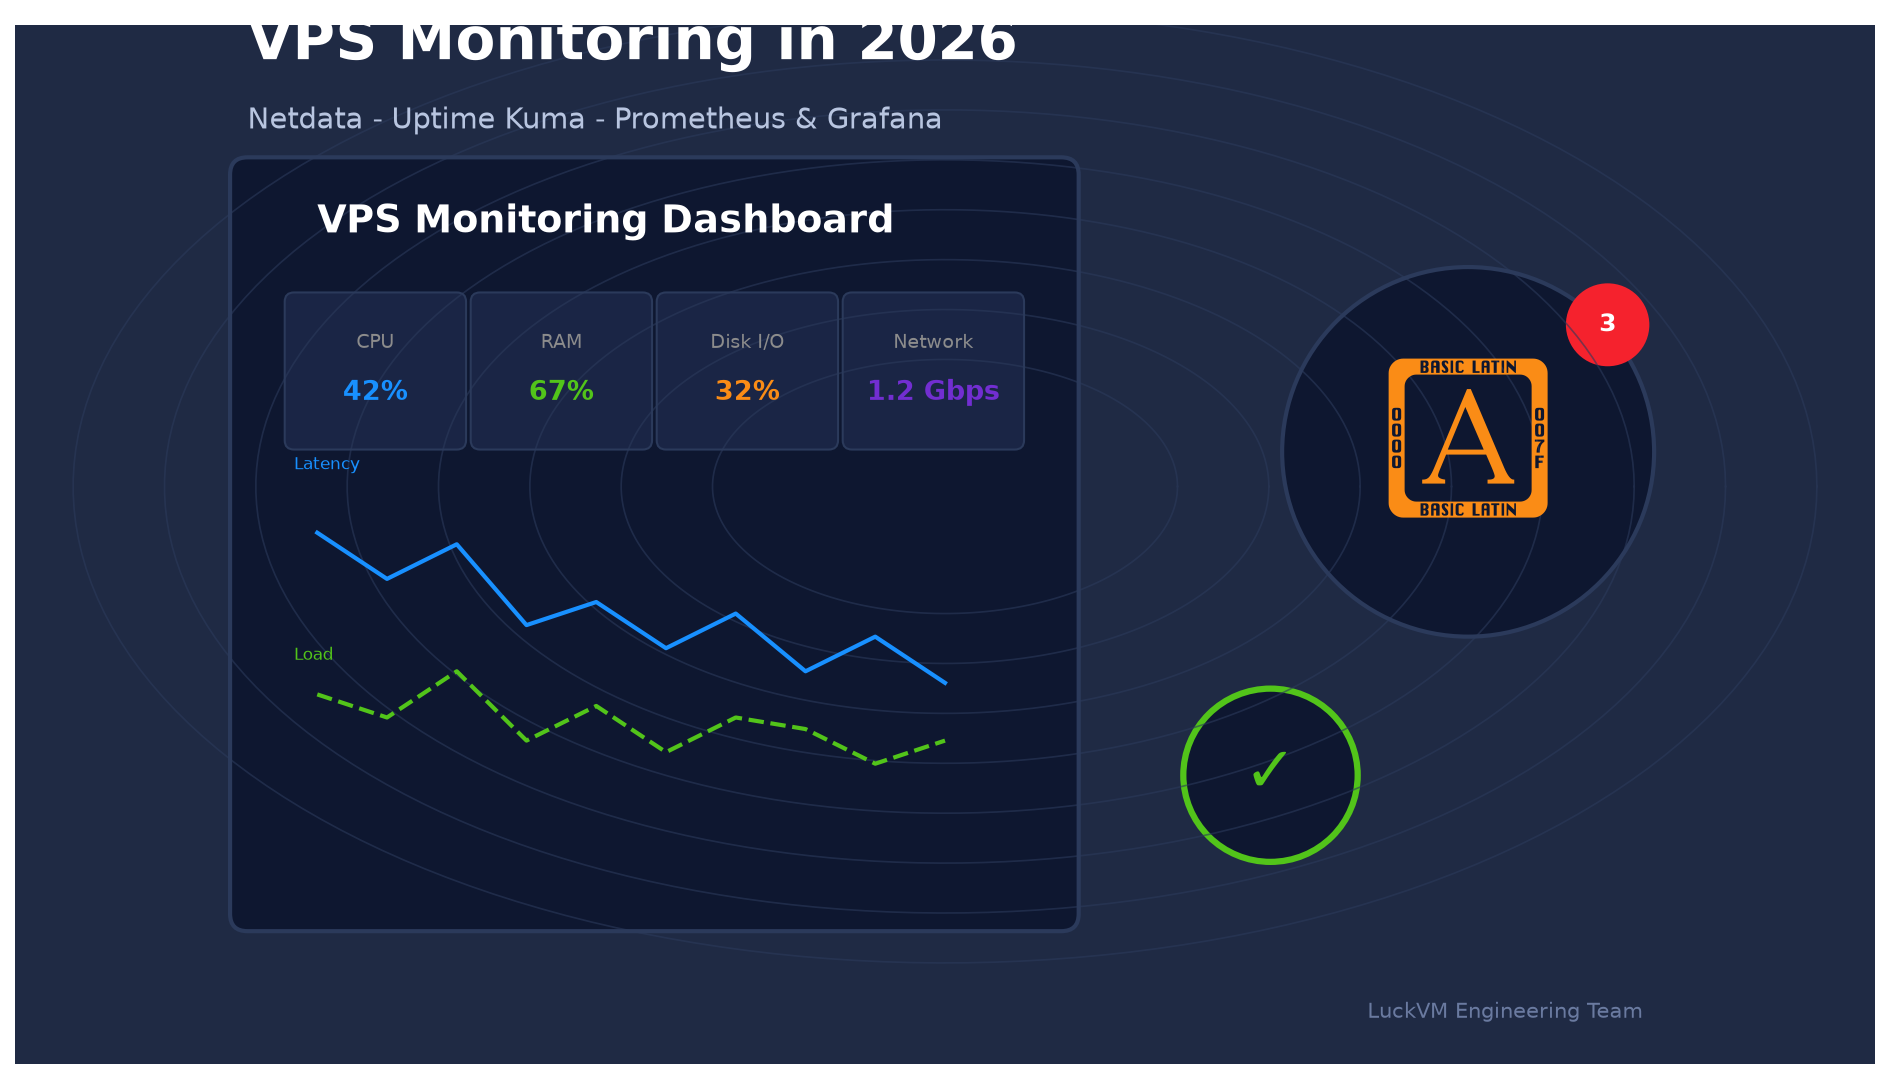
 Three complementary stacks: Netdata for depth, Uptime Kuma for external checks, Prometheus + Grafana for scale
1. Why You Must Monitor Your VPS Before It Fails
If you host a website, an app, a Minecraft server, or a Nextcloud instance on a VPS, you have probably already discovered an outage from a user DM or a customer email. By the time you know, the site has been down for minutes or hours. Monitoring flips that equation: you are the first to know, every time.
Good monitoring does three jobs at once:
- Tells you that something is broken before your visitors do (external uptime checks).
- Tells you why it is broken - was it a CPU spike? an out-of-memory kill? a disk that silently filled up? (in-system metrics).
- Tells you it is about to break - slow trends (rising RAM usage, shrinking free disk, climbing latency) you can act on during business hours instead of at 3 AM.
The 2026 monitoring landscape has settled on three excellent open-source tools, each designed for a different job. Stacking all three gives you enterprise-grade observability on a budget VPS. Stacking them incorrectly (running Uptime Kuma on the server it watches, for example) gives you a false sense of security.
2. Eight Metrics That Actually Matter
You do not need 200 charts on your wall. Eight metrics cover 95% of real production incidents on a VPS.
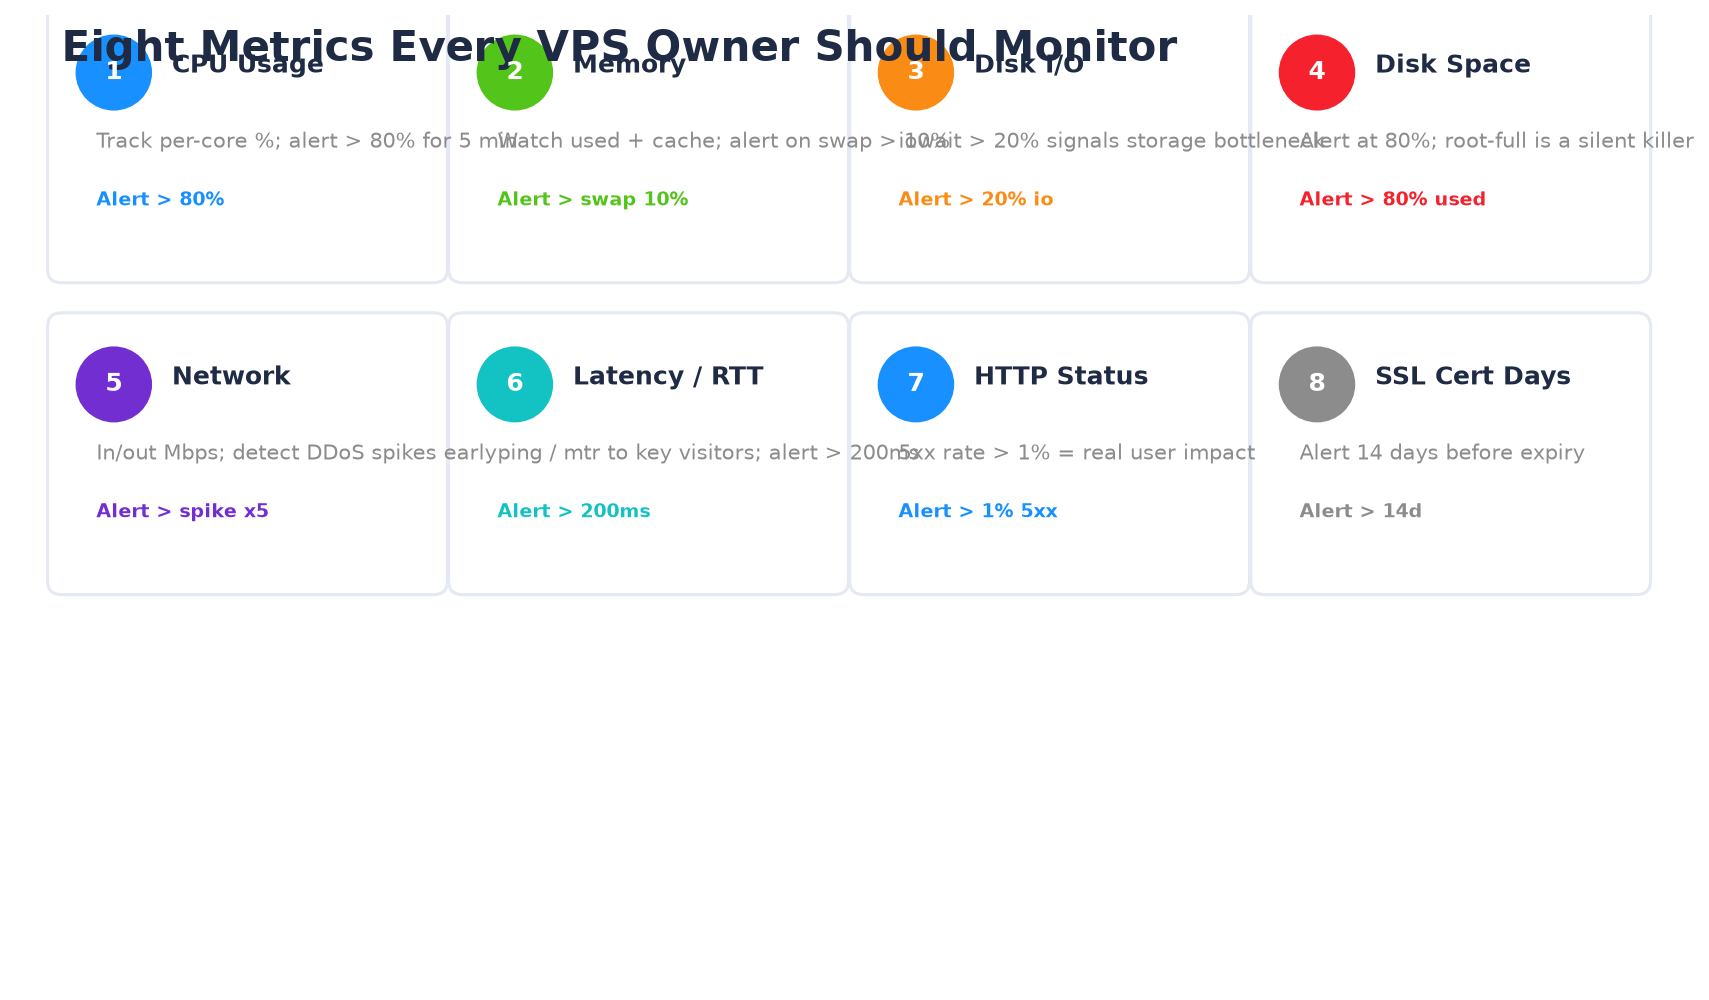 Track these eight and you will catch nearly every real-world incident
Three of these deserve special emphasis because they cause silent failures that show up weeks after the root cause:
- Disk space. Log rotation fails, databases stop committing, backups silently crash - all from a root filesystem that quietly hits 100%. Alert at 80% so you have time to clean up.
- Swap usage. A VPS that starts swapping under load will look "up" from ping but feel glacial to users - exactly the kind of degradation that goes unnoticed until complaints pour in.
- SSL certificate days remaining. Cert expiry is the most avoidable outage in existence. Alert 14 days out, not 1 day out.
3. Which Tool to Choose: A Side-by-Side Comparison
Each of the three tools in this guide solves a different problem. Picking the wrong one is the most common mistake newcomers make.
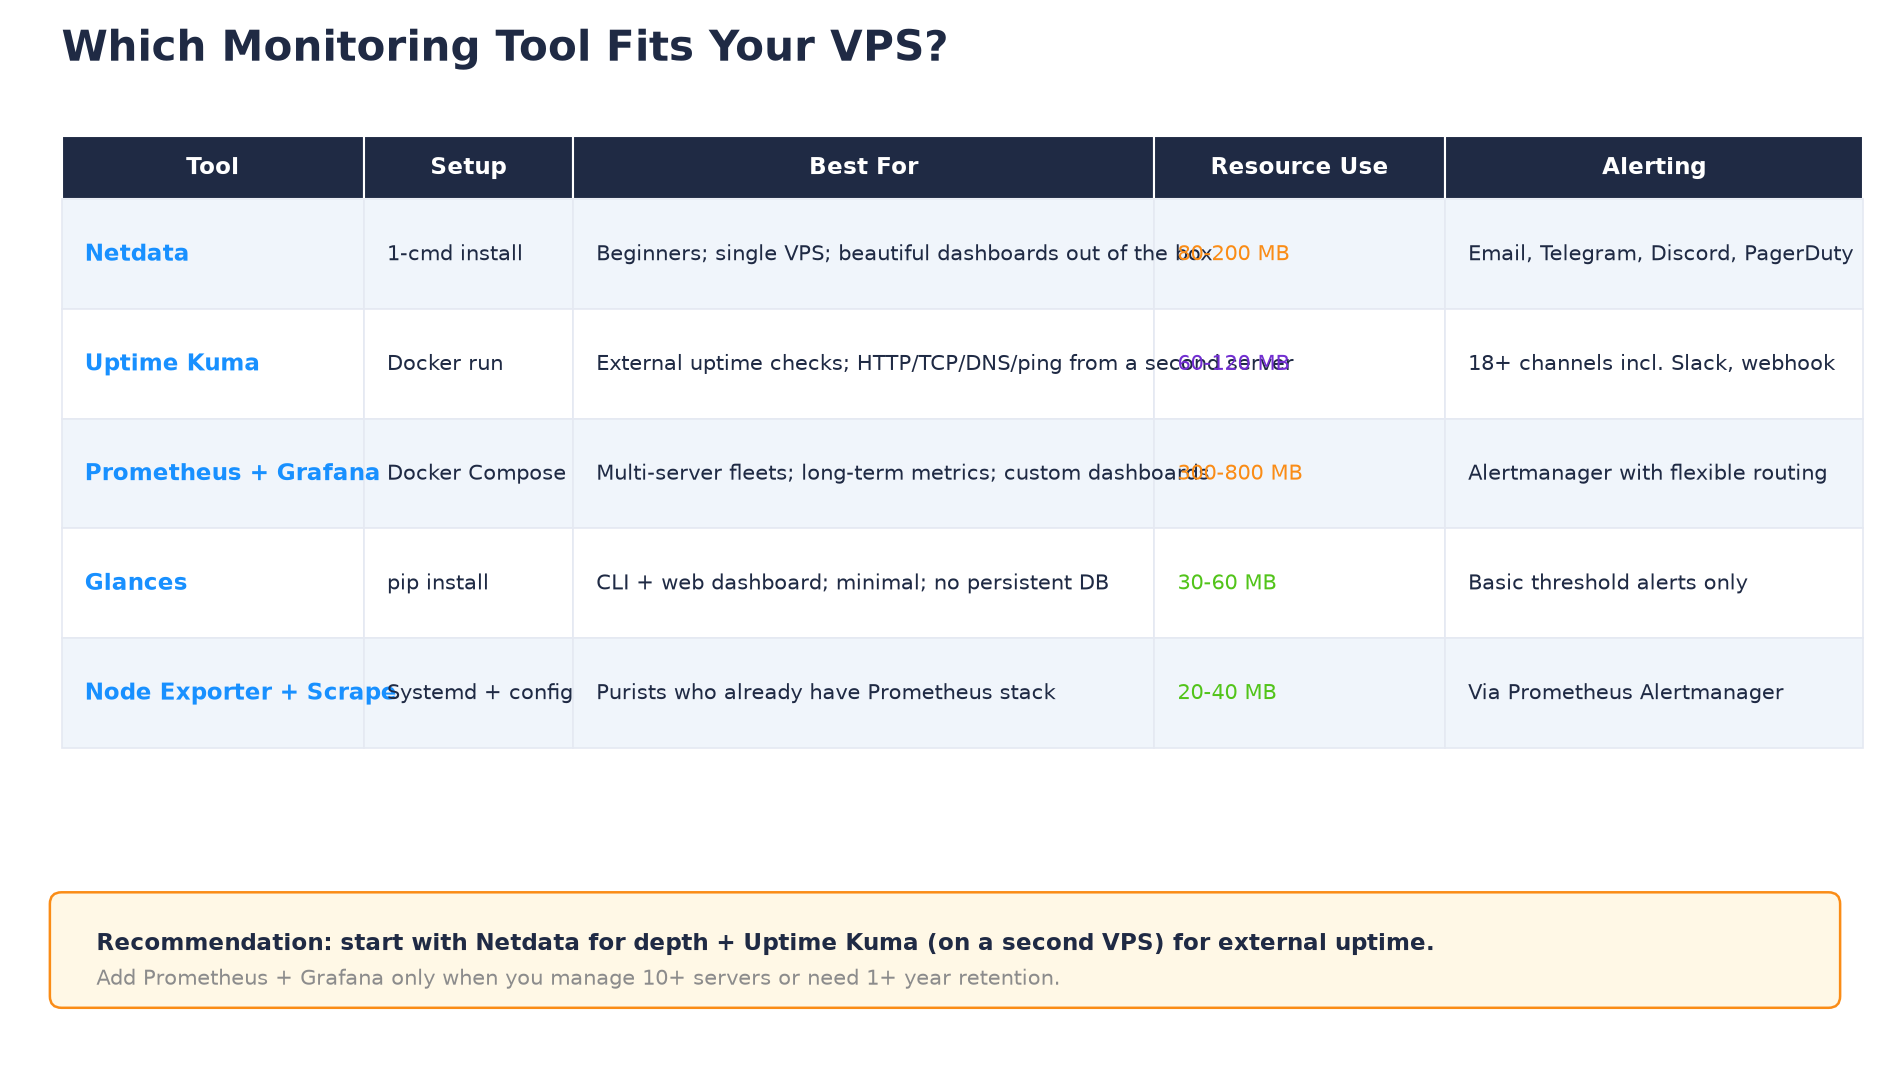 Start simple; add complexity only when the simple setup stops working
Here is the decision tree in one paragraph:
- Always install Netdata on every VPS you own. It takes 30 seconds, uses almost no RAM, and gives you instant visibility.
- Always run an external uptime probe from a second VPS (Uptime Kuma) or a third-party service (UptimeRobot free tier). Internal metrics cannot tell you that a network outage has taken your whole data center offline.
- Only when you hit 10+ servers, or need long-term retention, or want custom Grafana dashboards, add Prometheus + Grafana. Do not start here.
4. Part 1 - Install and Configure Netdata in 5 Minutes
Netdata is a single binary that installs with one command, auto-detects every service on your VPS (Nginx, MySQL, Redis, Docker, Postgres, PHP-FPM), and starts streaming a beautiful dashboard to port 19999 immediately.
4.1 Installation
# On any Ubuntu 22.04 / 24.04 or Debian 12 VPS:
wget -O /tmp/netdata-kickstart.sh https://get.netdata.cloud/kickstart.sh
sudo sh /tmp/netdata-kickstart.sh --non-interactive

# Verify:
sudo systemctl status netdata
# You should see: active (running)
Once running, visit http://YOUR-VPS-IP:19999 and you will see a full dashboard like this:
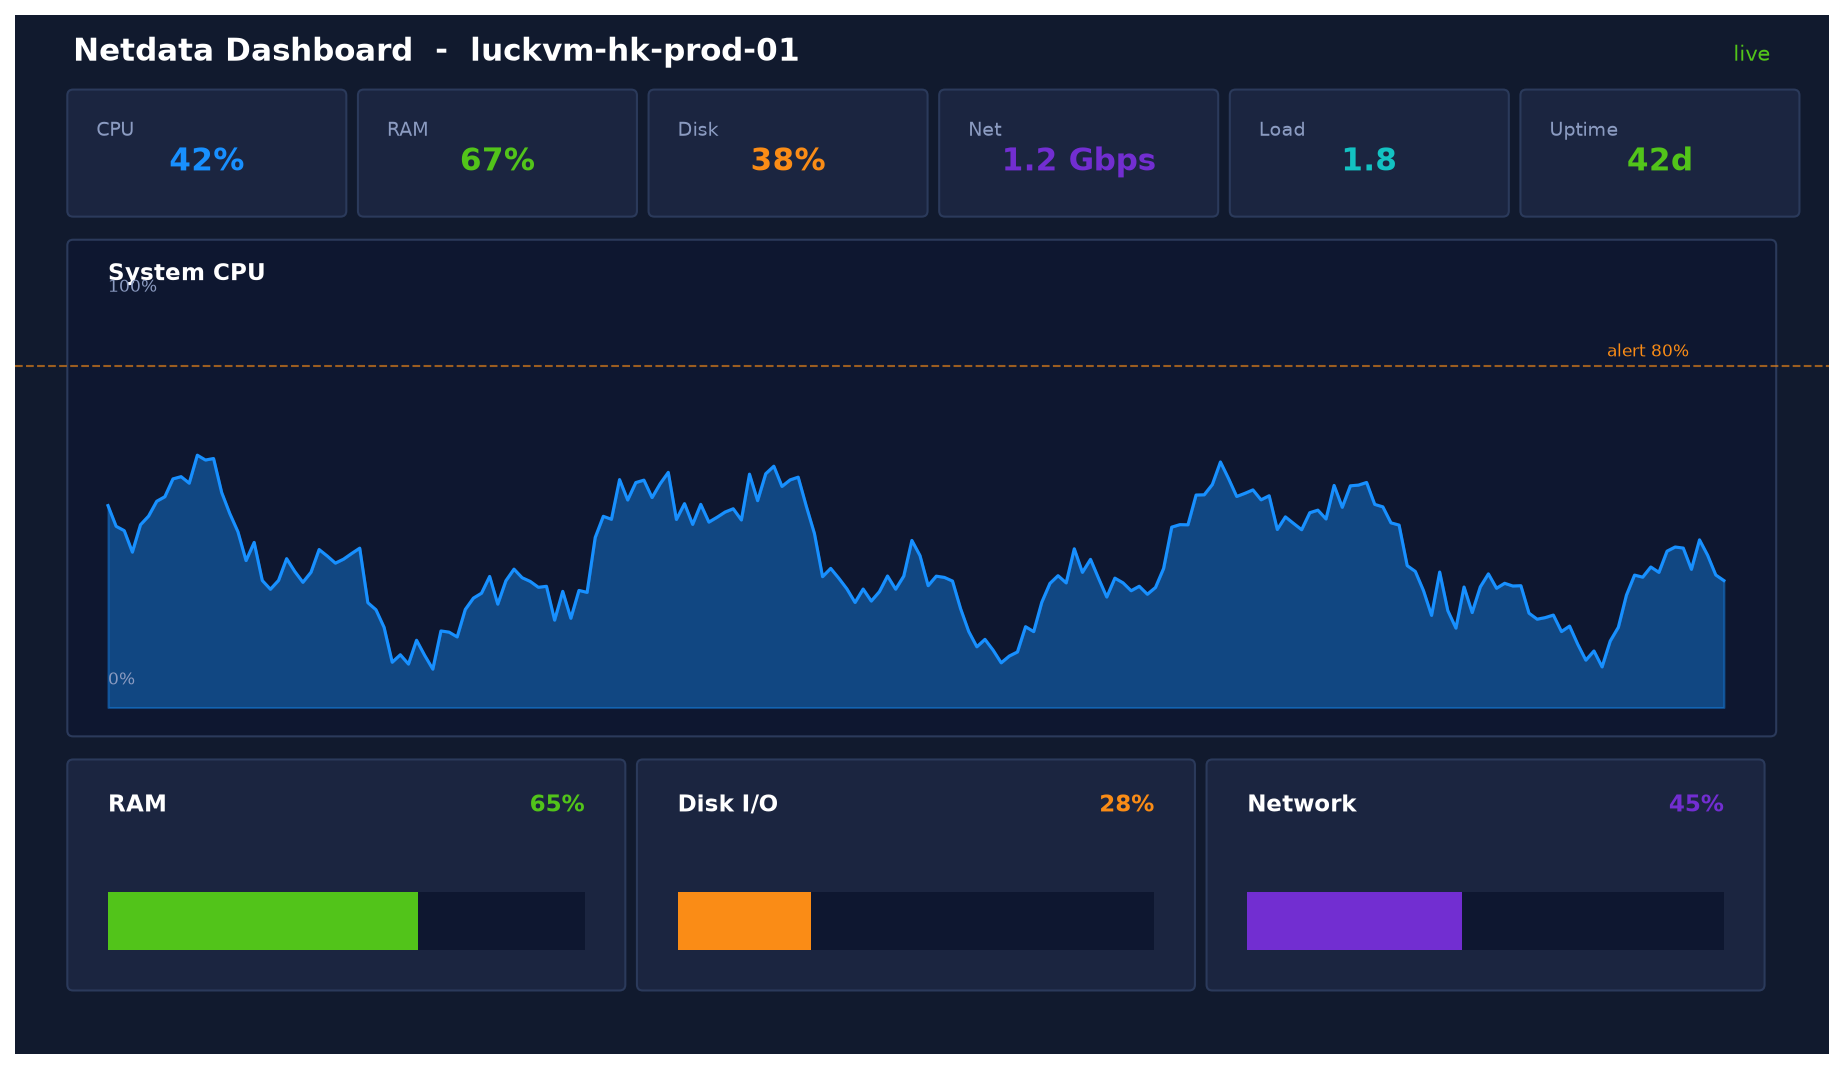 Default Netdata dashboard after a fresh install - zero configuration needed
4.2 Lock It Down (do not expose 19999 to the internet)
By default Netdata listens on all interfaces. Restrict it to localhost and access it through an SSH tunnel or an Nginx reverse proxy with a password.
sudo tee /etc/netdata/netdata.conf 4.3 Configure a Real Alert
Out of the box Netdata ships with dozens of sensible alerts, but you must tell it where to send them. Telegram is the most popular choice for solo operators because it works reliably on your phone without a paid plan.
# Edit the Telegram alert config
sudo tee /etc/netdata/health_alarm_notify.conf > /dev/null 5. Part 2 - Deploy Uptime Kuma on a Second VPS
This is the single most important sentence in this entire guide: never run Uptime Kuma on the VPS it is monitoring. If your production VPS goes down, the Kuma running on it will also go down, and you will receive zero alerts.
The fix is cheap: buy a second VPS in a different data center. If your production site is on LuckVM Hong Kong, put Kuma on LuckVM Los Angeles ($8.80/month) or LuckVM Singapore ($11/month). Total cost is less than one coffee per week.
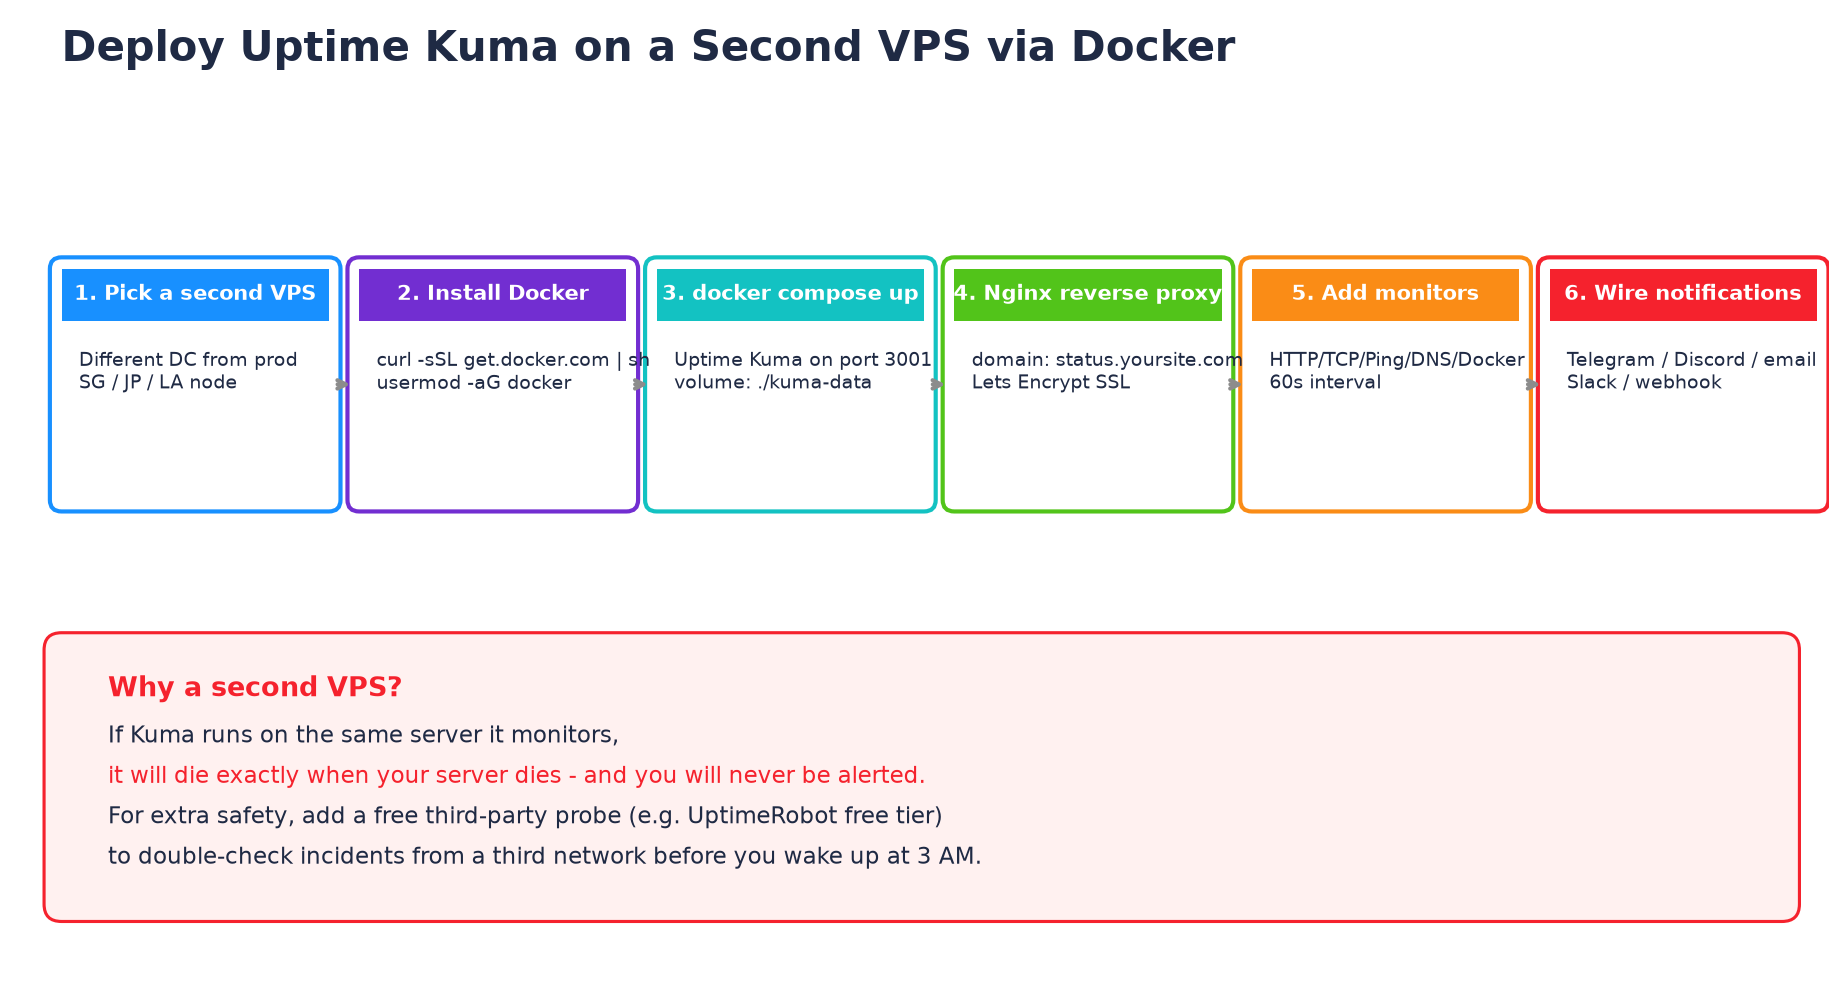 Six steps to a fully operational external uptime monitor
5.1 Install Docker
curl -fsSL https://get.docker.com | sudo sh
sudo usermod -aG docker $USER
# Log out and back in for the group change to apply
5.2 Deploy Uptime Kuma with Docker Compose
mkdir -p ~/uptime-kuma && cd ~/uptime-kuma
tee docker-compose.yml
5.3 Put It Behind Nginx with SSL
sudo apt install -y nginx certbot python3-certbot-nginx
sudo tee /etc/nginx/sites-available/kuma
Now open https://status.yourdomain.com, create your admin user, and add your first monitor. For a typical web app, create these five monitors:
- HTTP(s) Keyword check against your homepage, expecting a keyword like "Welcome" - this catches the dreaded "white page of death" when your app returns a blank 200.
- TCP port check on port 22 (SSH) and 3306 (MySQL, from an internal network) to detect service crashes that Nginx might mask.
- Ping for raw reachability; alerts you before the HTTP stack is even up.
- DNS check if you run your own resolver, otherwise a DNS lookup to a known good target to detect upstream DNS outages.
- SSL certificate expiry check - Kuma can warn you 14, 7, and 1 day before any cert on any monitored domain expires.
6. Part 3 - Prometheus + Grafana for Multi-Server Fleets
Once you run more than about 10 servers, Netdata's per-node dashboards become inconvenient, and you will want a single pane of glass. That is what the Prometheus + Grafana + Alertmanager stack is for.
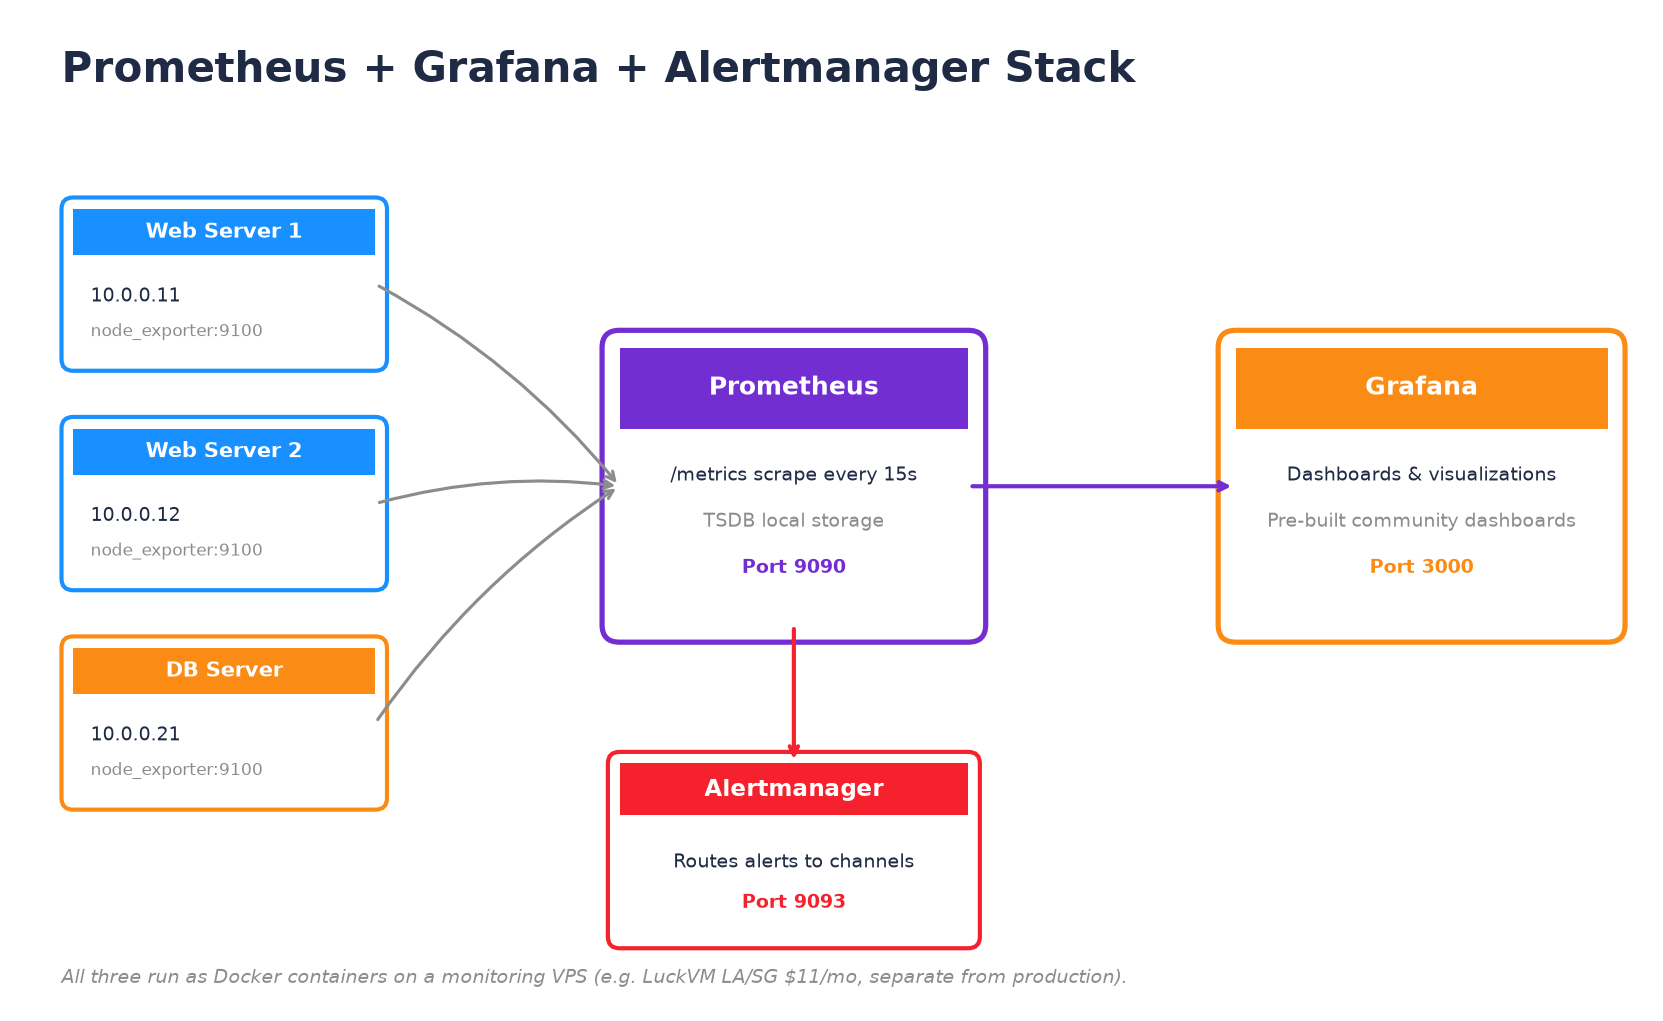 The classic open-source monitoring stack: scrape, store, alert, visualize
6.1 Deploy the Full Stack with Docker Compose
mkdir -p ~/monitoring/{prometheus,grafana,alertmanager} && cd ~/monitoring

# Prometheus config
tee prometheus/prometheus.yml  85
        for: 10m
        labels: { severity: warning }
        annotations:
          summary: "CPU above 85% for 10 min on {{ $labels.instance }}"
      - alert: DiskFilling
        expr: (node_filesystem_avail_bytes{mountpoint="/"} / node_filesystem_size_bytes{mountpoint="/"})
6.2 Install node_exporter on Every Server You Want to Monitor
# Run on each production VPS (not on the monitoring VPS):
wget https://github.com/prometheus/node_exporter/releases/latest/download/node_exporter-1.8.2.linux-amd64.tar.gz
tar xzf node_exporter-*.linux-amd64.tar.gz
sudo mv node_exporter-*.linux-amd64/node_exporter /usr/local/bin/

sudo tee /etc/systemd/system/node_exporter.service
After 2-3 minutes, open http://localhost:3000 (via SSH tunnel to the monitoring VPS), log into Grafana with admin / the password you set, add Prometheus as a data source at http://prometheus:9090, and import dashboard 1860 (Node Exporter Full) from the public dashboard library - you will immediately have one of the best open-source infrastructure dashboards ever built.
7. Alerting That Wakes You Up When It Matters
Alert routing is the part of monitoring teams get wrong most often. The cardinal rule is never page a human for something they cannot fix. If CPU is at 90% for 10 minutes but requests are still fast and users are not complaining, send an email or a Slack message, not a 3 AM push notification.
Recommended channel routing for solo operators and small teams:
| Severity | Channel | Examples |
|---|---|---|
| Critical | Phone push / Telegram / PagerDuty | Instance down, HTTP 5xx > 5%, disk |
| Warning | Discord / Slack / Email digest | CPU > 85% for 10 min, RAM > 90%, backup job failed |
| Info | Dashboard only, no notification | Routine metrics, login events, deployments |
8. Five Common Monitoring Mistakes to Avoid
- Monitoring the server from itself. External uptime probes must live on a different server in a different network. Same box = same failure domain.
- Over-alerting. Every alert must have a defined action. "Disk at 80%" should not be critical at 2 AM; it should be a morning email.
- No retention policy. Netdata stores detailed metrics for a few days by default. For trend analysis you need weeks or months - configure retention or route to Prometheus.
- Forgetting to test alerts. Once a month, deliberately stop Nginx on a staging box and confirm you actually get the alert. Alerts that were never tested do not work.
- Ignoring egress costs. Prometheus pulls metrics every 15s; across 20 servers this is trivial. Shipping logs or traces can burn bandwidth quickly on metered plans.
9. Which LuckVM Plan for Monitoring?
Monitoring workloads are light on RAM but benefit from a stable, well-connected VPS because they need to reach all your production servers reliably.
| Use Case | Recommended Plan | Region | Why |
|---|---|---|---|
| Netdata only (installed on each prod VPS) | No extra server needed | - | Netdata's 80-150 MB footprint fits on the prod VPS itself. |
| Uptime Kuma (external probe) | Starter - $8.80/mo | Opposite DC from prod | 1 vCPU / 1 GB RAM / 70 GB NVMe is plenty for 50 monitors. |
| Kuma + Netdata Cloud peer | Starter - $8.80-$11/mo | LA or SG | Adds ~50 MB RAM; still trivial. |
| Full Prometheus + Grafana stack (10-30 nodes) | Standard - $26.40/mo | SG or LA | 2 vCPU / 4 GB RAM / 100 GB NVMe holds 1 year of metrics. |
| Prometheus + Grafana + Loki logs (30+ nodes) | Professional - $48.40/mo | Any | 4 vCPU / 8 GB RAM / 180 GB NVMe handles logs + traces too. |
Prices shown are as of October 2026 on the LuckVM website; check the pricing page for current offers. If most of your production is in Asia (Hong Kong / Tokyo / Singapore), locate your monitoring VPS in Los Angeles so that a regional fiber cut does not take out both prod and monitoring at once.
10. Frequently Asked Questions
Can I run Uptime Kuma on the same VPS as my website?
No. If that VPS crashes, both your website and your monitoring go down together. Deploy Kuma on a separate VPS in a different data center - LuckVM's $8.80 LA Starter plan is perfect for this.
How much RAM does Netdata use?
Expect 80-150 MB on a typical VPS, rising to 200-300 MB on servers with hundreds of containers or disks. This is light enough to run on every production box without measurable overhead.
Is Netdata better than Prometheus + Grafana?
They solve different problems. Netdata is for instant per-node visibility and takes 30 seconds to install. Prometheus + Grafana is for multi-server aggregation, custom dashboards, and long-term retention. Use both if you run more than a handful of servers.
How often should Prometheus scrape metrics?
15 seconds is the default and works well for most VPS workloads. Go to 30 seconds or 1 minute if you have >50 nodes and are worried about storage; anything faster than 10 seconds is almost never worth it.
Can I monitor Windows servers with these tools?
Yes. Install windows_exporter on Windows machines and point Prometheus at it; Grafana has pre-built Windows dashboards (dashboard ID 14694 works well). Uptime Kuma's HTTP/TCP/Ping monitors work identically against Windows targets.
Do I need to open firewall ports for monitoring?
Only for Prometheus scraping port 9100 (node_exporter) - and you must whitelist it to your monitoring VPS IP only, using ufw allow from MONITOR-IP to any port 9100. Uptime Kuma probes services on their normal public ports (80, 443, 22) so no extra firewall rules are needed for it. Netdata should be bound to localhost only.
How long should I retain metrics?
For capacity planning, keep at least 30 days of high-resolution data and one year of downsampled data. Prometheus defaults to 15 days; set --storage.tsdb.retention.time=1y to extend it, and budget roughly 8 KB per series per day of retention.
What is the best free alternative if I do not want a second VPS?
UptimeRobot's free plan gives you 50 monitors at 5-minute intervals from multiple locations. Better Stack (formerly Better Uptime) offers a generous free tier as well. Use these as a complement to your self-hosted monitoring, not a replacement.
Ready to stand up your monitoring VPS?
LuckVM's $8.80 Starter plan in Los Angeles makes the perfect external monitoring node - separate from your production Hong Kong or Singapore VPS, with 70 GB NVMe and unlimited traffic. Deploy in 5-10 minutes.
Pick a VPS Plan