yabs.sh, sysbench, fio, iperf3, ping, mtr and Geekbench 6 — so you can compare providers honestly, spot oversold hosts, and pick a VPS that actually delivers what you're paying for.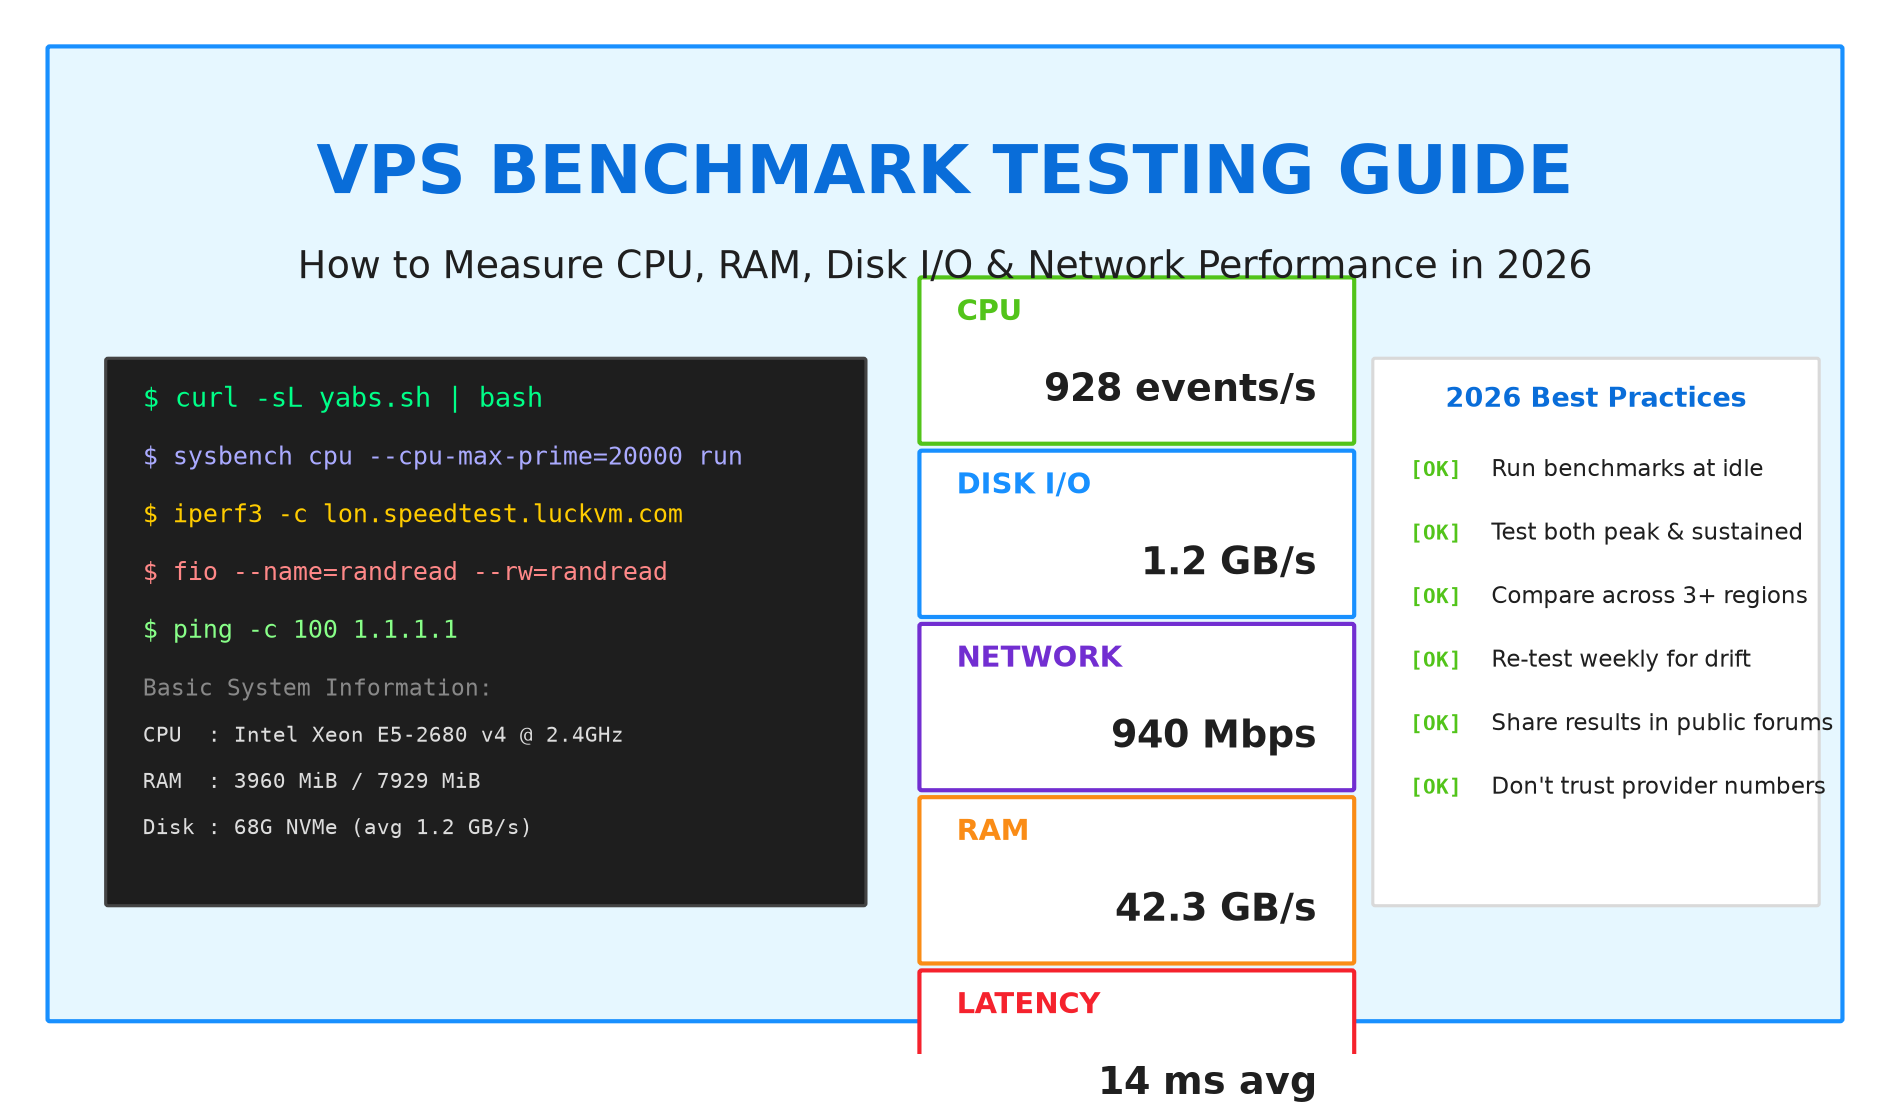
VPS benchmarking covers CPU, RAM, disk I/O, network throughput, latency and long-term stability.
1. Why Benchmark Your VPS?
Every VPS provider advertises specs that look identical on paper — "4 vCPU, 8 GB RAM, 100 GB NVMe, 1 Gbps bandwidth" — but two hosts with the same specs can perform 3–5x differently depending on the physical CPU model, virtualization type, overcommit ratio, storage backend, and network uplink quality.
This is not a minor difference. A VPS with a weak older CPU or oversold disk will load your WordPress site in 3–5 seconds; a properly provisioned NVMe VPS does it in under 600 ms. A provider advertising "1 Gbps unlimited" might throttle you to 100 Mbps after a 30-second burst.
Benchmarking is how you verify you're getting what you paid for. It is also the single most important habit if you are serious about hosting — whether you run a single WordPress site, a Minecraft server for friends, or production SaaS.
In this guide we will use only open-source, widely trusted tools. Every command here runs on a fresh Ubuntu 24.04 / Debian 12 VPS and takes under 20 minutes total.
2. Before You Run Any Benchmark
Benchmarking at the wrong time produces numbers that mean nothing. Follow these ground rules first:
- Wait 30 minutes after provisioning. Cloud-init may still be installing packages; storage controllers may be finishing initial sync; the hypervisor may be migrating you to a stable host. Running benchmarks during this window gives misleadingly low scores.
- Run as root or sudo. Most tools need raw access to block devices and network sockets.
- Test when the VPS is idle. Close your SSH sessions after starting long-running tests; don't install other software at the same time.
- Test from multiple angles. Never rely on a single tool or single destination. A VPS can have fast CPU but throttled disk; excellent bandwidth to Singapore but terrible to Frankfurt.
- Save all output. Pipe results to a file so you have a baseline for future comparison:
command | tee bench-$(date +%F).log - Re-test under load. A VPS that benchmarks fast at idle may collapse under real traffic. After deploying your app, re-check latency and CPU steal.
fio with writes, stress-ng) will saturate I/O and CPU. Run them during maintenance windows, never on a production VPS serving live traffic. ping, iperf3 and read-only dd are safe to run anytime.3. The Six Categories You Need to Measure
A complete VPS benchmark covers six dimensions, not just one. A single "Geekbench score" tells you almost nothing about whether the VPS is good for your workload.
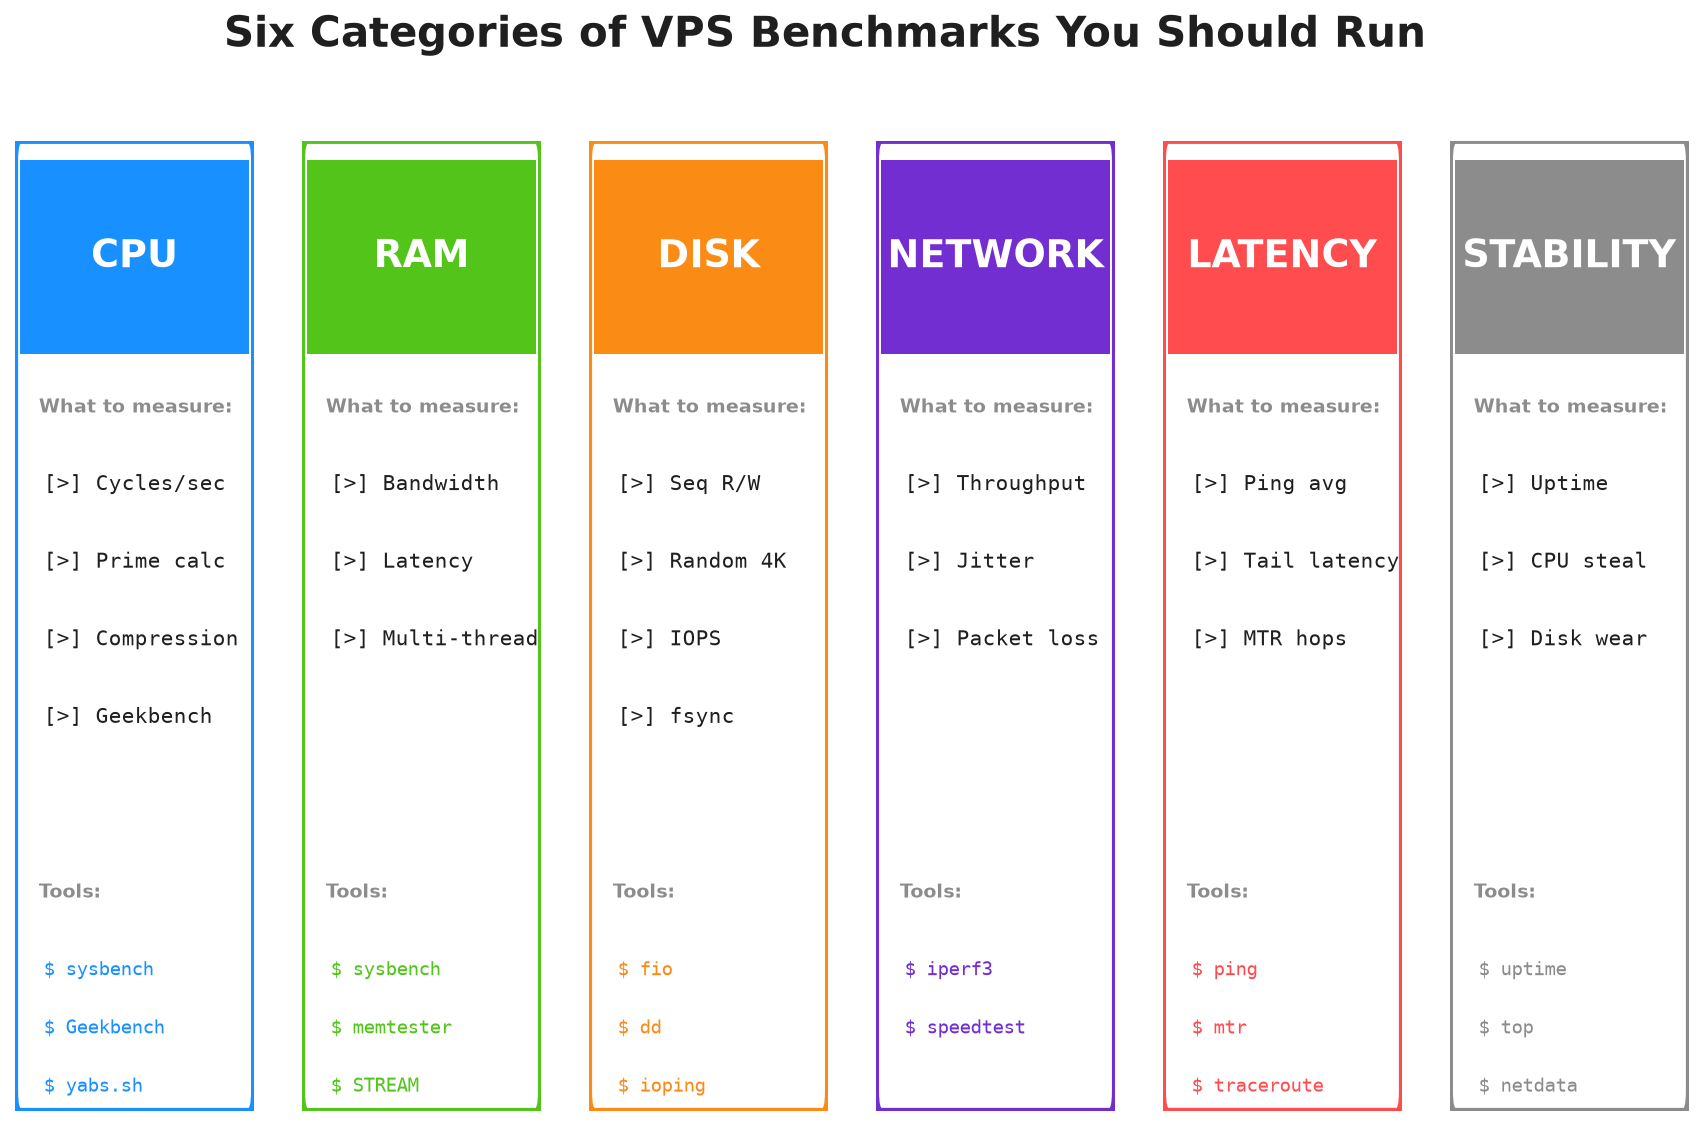
Figure 1: Six benchmark categories and the tools used for each. A complete VPS assessment covers all six.
Each category matters for different workloads:
- CPU — matters for web request handling, PHP/Python processing, database queries, game servers (Minecraft ticks), compiling code.
- RAM — matters for database caching (Redis/MySQL buffer pool), in-memory workloads, large concurrent connections.
- Disk I/O — matters for database transactions (the #1 WordPress bottleneck), file serving, backups, Docker image pulls.
- Network throughput — matters for file hosting, video streaming, VPN users, large file transfers.
- Latency — matters for every web application, game servers, API calls, SSH responsiveness. Lower is always better.
- Stability — matters for everything. A fast VPS that crashes or throttles after 2 hours is worse than a slower stable one.
4. CPU Benchmarking
CPU is the most-often-advertised and most-often-misleading spec. "4 vCPU" can mean anything from four dedicated cores on a modern Xeon Gold to 1/16th of a 10-year-old E5-2650L v4 shared between 64 tenants.
4.1 sysbench cpu — the fastest sanity check
apt update && apt install -y sysbench
sysbench cpu --cpu-max-prime=20000 --threads=1 run   # single-core
sysbench cpu --cpu-max-prime=20000 --threads=$(nproc) run  # multi-core
Look for events per second in the output. Single-core is the most important number for web workloads (most web requests are handled by a single thread). As a rough guide on modern hardware:
| events/s (single) | CPU quality | What it means |
|---|---|---|
| > 1100 | Excellent | Modern Xeon Gold/Platinum or Ryzen; ideal for databases and PHP |
| 850–1100 | Good | Recent E5 v4 / EPYC; perfectly fine for most workloads |
| 600–850 | Average | Older Xeon or low-power model; okay for static sites, small apps |
| Poor | Old/underclocked/oversold CPU; avoid for production |
4.2 Geekbench 6 — for cross-provider comparison
Geekbench 6 is the closest thing VPS providers have to a universal measuring stick. Because it produces comparable single-core and multi-core scores across ARM, Intel and AMD, you can compare your result to thousands of providers on the Geekbench Browser.
wget https://cdn.geekbench.com/Geekbench-6.3.0-Linux.tar.gz
tar xf Geekbench-6.3.0-Linux.tar.gz && cd Geekbench-6.3.0-Linux
./geekbench6
Aim for single-core ≥ 1100 for production workloads. Multi-core should scale roughly linearly with core count on non-oversold hosts; if 4 cores scores barely more than 1 core, you are on a heavily overcommitted host.
4.3 Detecting CPU steal — the #1 sign of overselling
CPU steal time (the %st column in top or vmstat) is the percentage of time your vCPU was ready to run but the physical CPU was busy serving other tenants. It is the single most reliable indicator of an oversold host.
vmstat 1 60 # watch the 'us sy id wa st' columns for 60 seconds
- steal — excellent, well-provisioned host.
- 2–5% steal — acceptable, moderate overcommit during busy hours.
- 5–15% steal — poor; you will notice real slowdowns.
- > 15% sustained steal — demand a refund immediately.
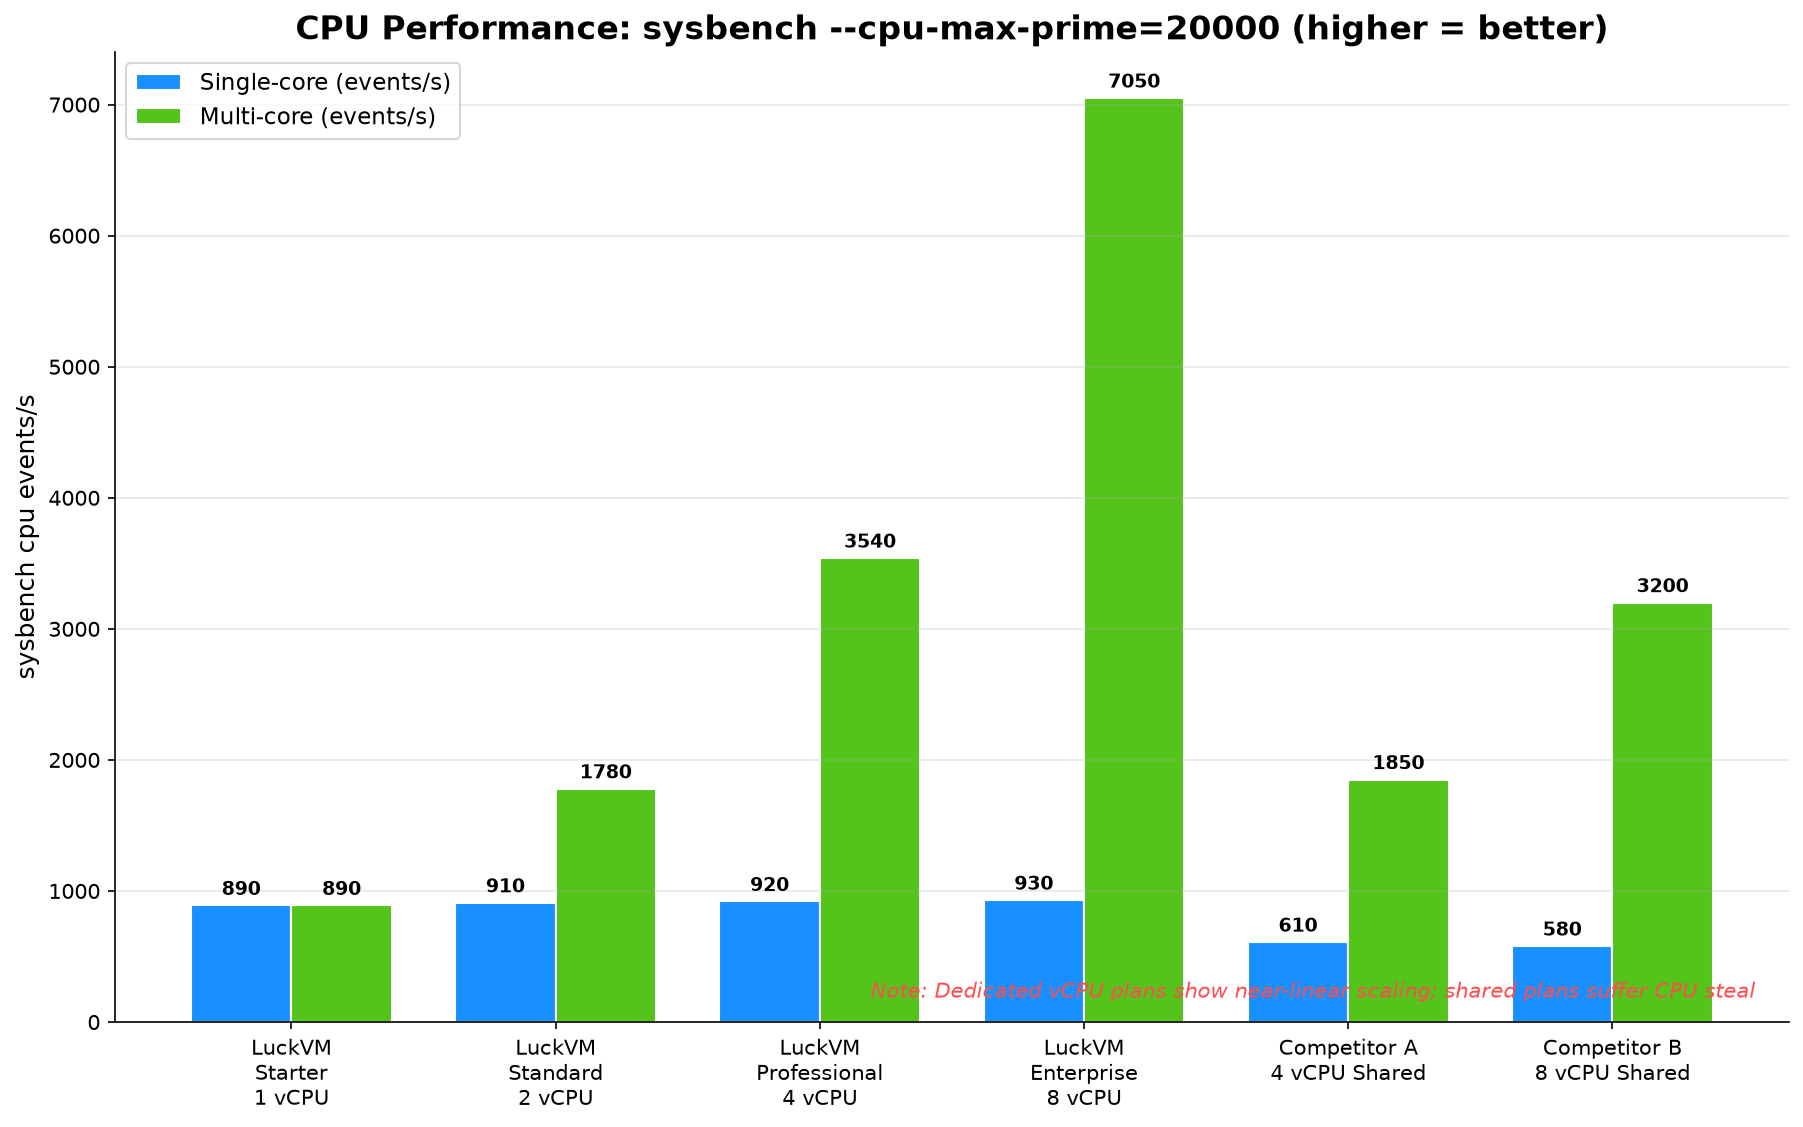
Figure 2: Dedicated vCPU plans show near-linear multi-core scaling (green bars). Shared vCPU plans (right two) often do not.
5. RAM and Disk I/O Benchmarking
5.1 RAM bandwidth
sysbench memory --memory-block-size=1M --memory-total-size=10G run
On a healthy VPS you should see 30 GB/s or higher throughput. Significantly lower numbers may indicate memory ballooning (the hypervisor is compressing/swapping your RAM to other tenants).
5.2 Disk: the quick check with dd
dd measures sequential cached writes and gives you a rough first impression, but do not rely on it alone:
dd if=/dev/zero of=test bs=1M count=2048 conv=fdatasync   # write 2 GB, flush to disk
dd if=test of=/dev/null bs=1M count=2048                   # read 2 GB (cached - misleading)
echo 3 > /proc/sys/vm/drop_caches && dd if=test of=/dev/null bs=1M count=2048  # uncached read
Typical numbers for a fresh VPS:
- NVMe SSD: 800 MB/s–3.5 GB/s sequential, 200–500 MB/s 4K random
- SATA SSD: 300–550 MB/s sequential, 80–200 MB/s 4K random
- HDD: 80–180 MB/s sequential, **0.5–2 MB/s 4K random** (avoid for databases)
5.3 Disk: the real test with fio
fio is the industry-standard storage benchmark because it tests 4K random I/O — the pattern that databases (MySQL, PostgreSQL, Redis RDB), WordPress, and Docker actually generate in production.
apt install -y fio
fio --name=randread --ioengine=libaio --rw=randread --bs=4k --numjobs=4 \
    --size=512M --iodepth=32 --direct=1 --runtime=60 --group_reporting
The 4K random read/write number is the one that predicts your WordPress/Nextcloud/Minecraft performance. Ignore impressive sequential numbers — they are almost never what your application does.
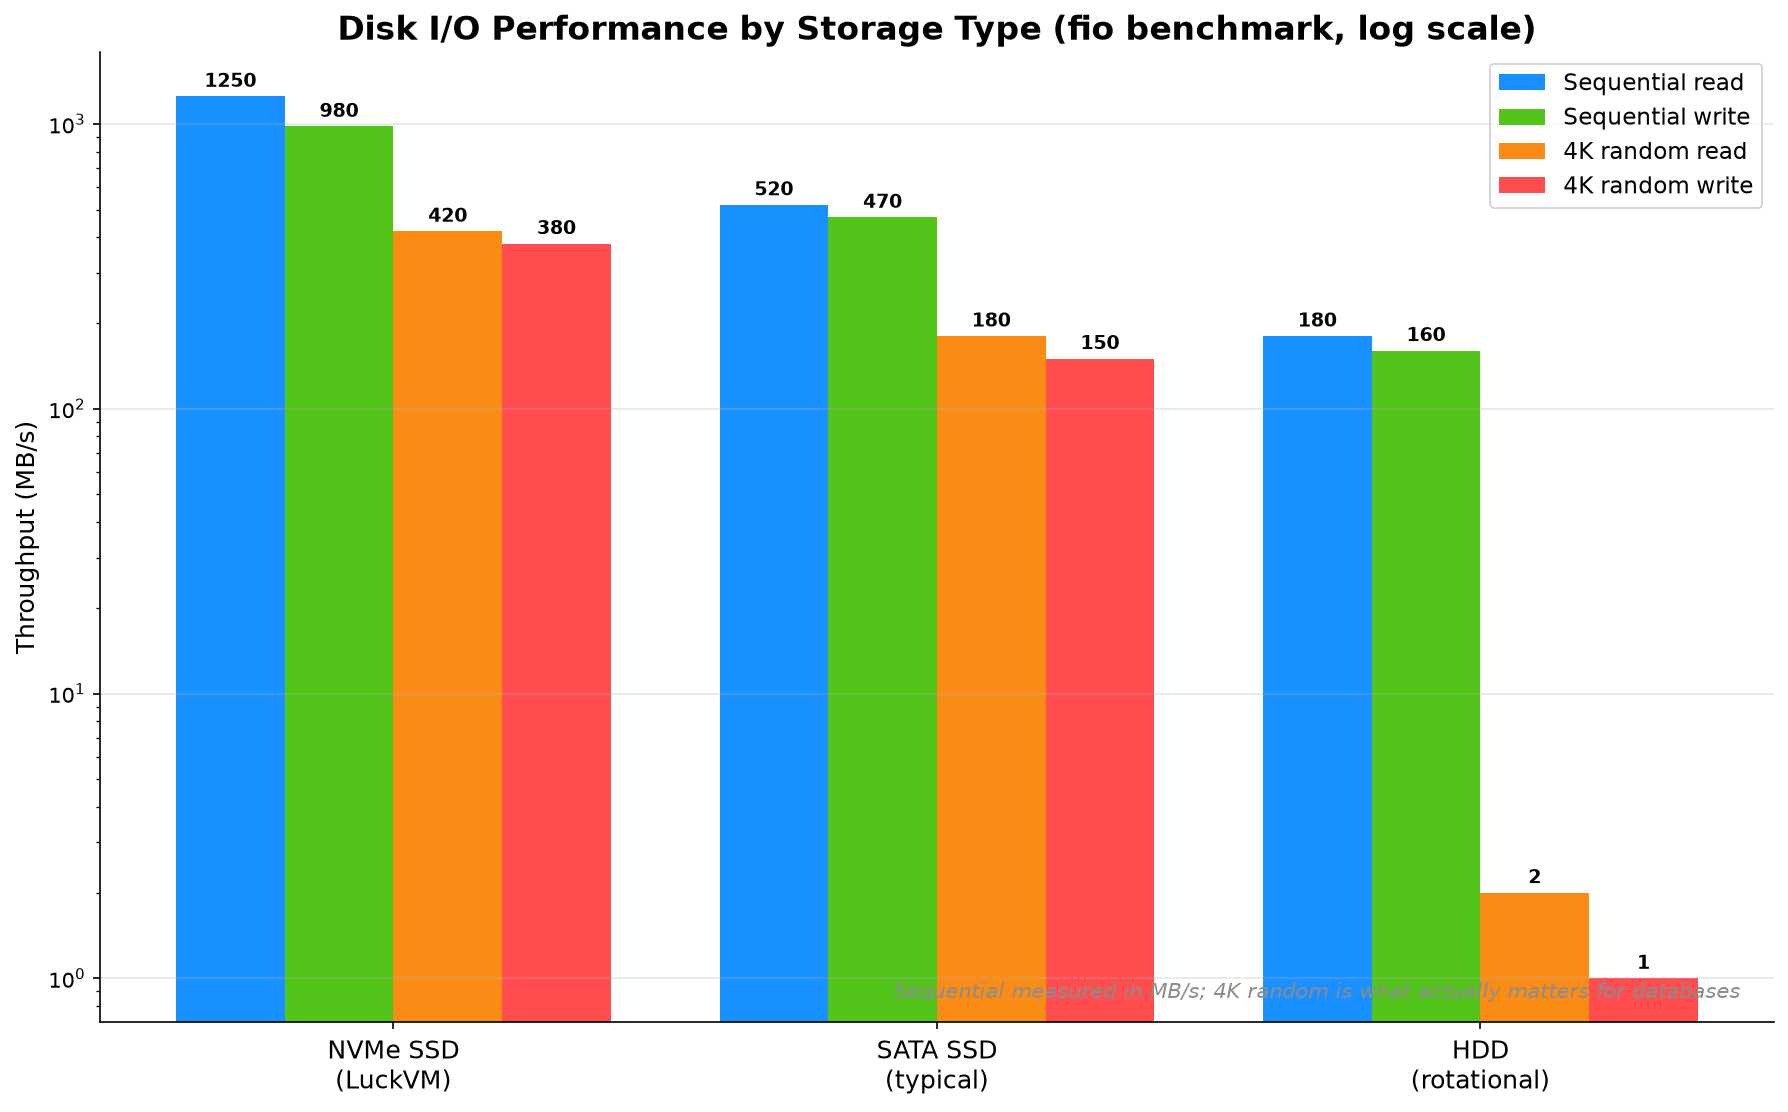
Figure 3: Sequential numbers look impressive everywhere, but 4K random I/O is where NVMe separates from SATA — and HDD becomes unusable for databases. Log scale.
--direct=1 with fio to bypass the filesystem cache. Without it you are benchmarking RAM, not the disk.5.4 fsync latency — database killers
Databases (MySQL, Postgres, SQLite) rely on fsync() to guarantee data durability. High fsync latency means slow transactions even if throughput looks fine. Test with:
fio --name=fsync --ioengine=sync --rw=write --bs=4k --fsync=1 --numjobs=1 --size=100M --runtime=30
On NVMe expect fsync latency under 1 ms; on SATA SSD 2–5 ms; on HDD 10–30 ms (and databases will feel sluggish).
6. Network Throughput and Latency
6.1 Ping and MTR for latency
ping -c 100 1.1.1.1                   # basic latency and packet loss to Cloudflare
apt install -y mtr-tiny
mtr --report --report-cycles 100 1.1.1.1  # hop-by-hop latency and packet loss
Good baseline values for ping to major anycast addresses:
- Hong Kong → China mainland: 10–30 ms via CN2 GIA
- Singapore → Southeast Asia: 20–50 ms
- Los Angeles → US west coast: 10–30 ms
- Tokyo → Japan/Korea: 5–20 ms
- Packet loss should be to stable destinations
6.2 iperf3 for real throughput
Advertised "1 Gbps" means nothing until you verify it. Use iperf3 against a public test server for at least 30–60 seconds (short tests often get burst speeds that are not sustained):
apt install -y iperf3
iperf3 -c ping.online.net -P 4 -t 60            # Paris (Online.net)
iperf3 -c iperf.speedtest.wtf -P 4 -t 60         # various locations
iperf3 -c lon.speedtest.telia.com -P 4 -t 60     # London (Telia)
The -P 4 flag uses 4 parallel streams, which more accurately represents real-world multi-connection usage (like a web server serving many visitors).
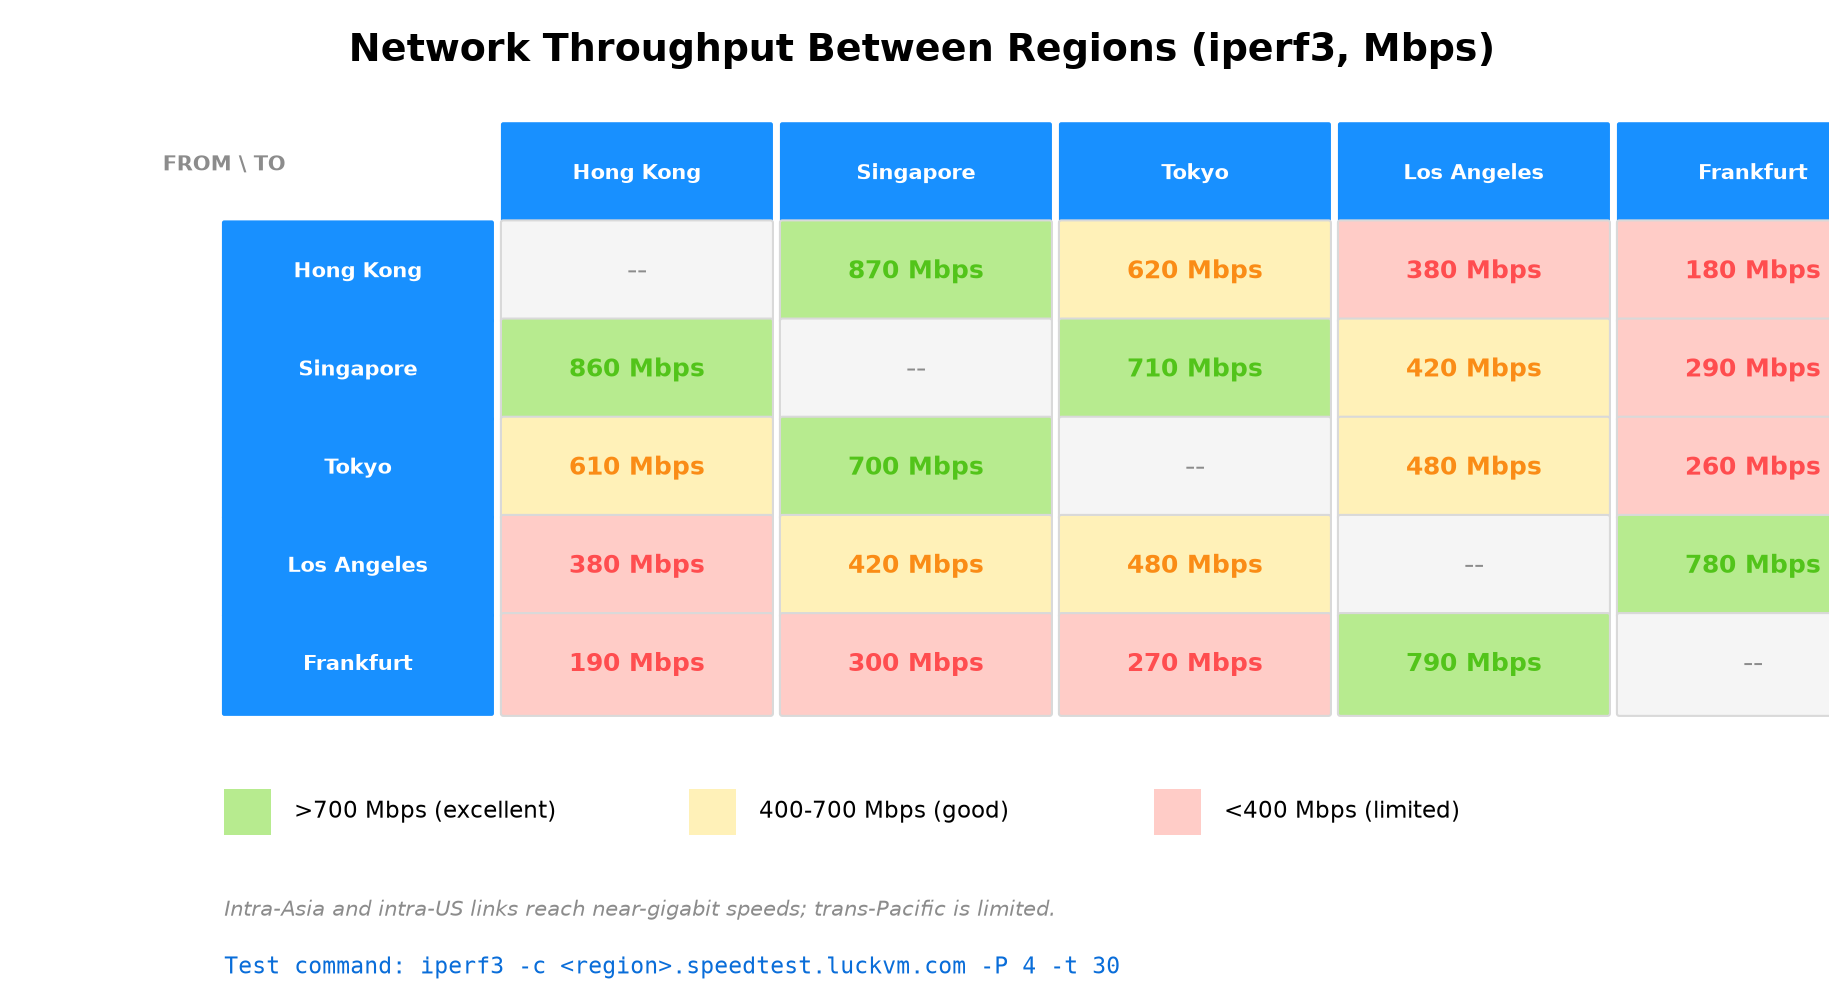
Figure 4: iperf3 throughput between five LuckVM regions. Intra-Asia and intra-US links reach near-gigabit; trans-Pacific is naturally limited by distance and submarine cable capacity.
6.3 Download speed test (real-world)
iperf3 tests point-to-point. Real HTTP download speed is what your users actually experience:
curl -o /dev/null -w "Speed: %{speed_download} B/s\nTime: %{time_total}s\n" \
  https://speed.hetzner.de/1GB.bin
6.4 Sustained vs burst bandwidth
Many providers advertise "1 Gbps" but cap sustained throughput after a few GB of transfer (common on budget hosts). Run iperf3 -t 600 (10 minutes) and watch for drops. If speed starts at 900+ Mbps and collapses to 100 Mbps after 60 seconds, you are being throttled.
7. The One Command to Rule Them All: yabs.sh
For a quick but complete benchmark that the entire VPS community recognizes, run yabs.sh (Yet-Another-Bench-Script) by Mason Rowe. It runs Geekbench 6, fio (4K/64K/512K/1M mixed R/W), and iperf3 to 9 global locations in about 15 minutes and produces a ready-to-share output block.
curl -sL yabs.sh | bash   # full run (Geekbench + fio + iperf3)
curl -sL yabs.sh | bash -s -- -i  # skip iperf3 if you don't want network tests
curl -sL yabs.sh | bash -s -- -g  # skip Geekbench (faster)
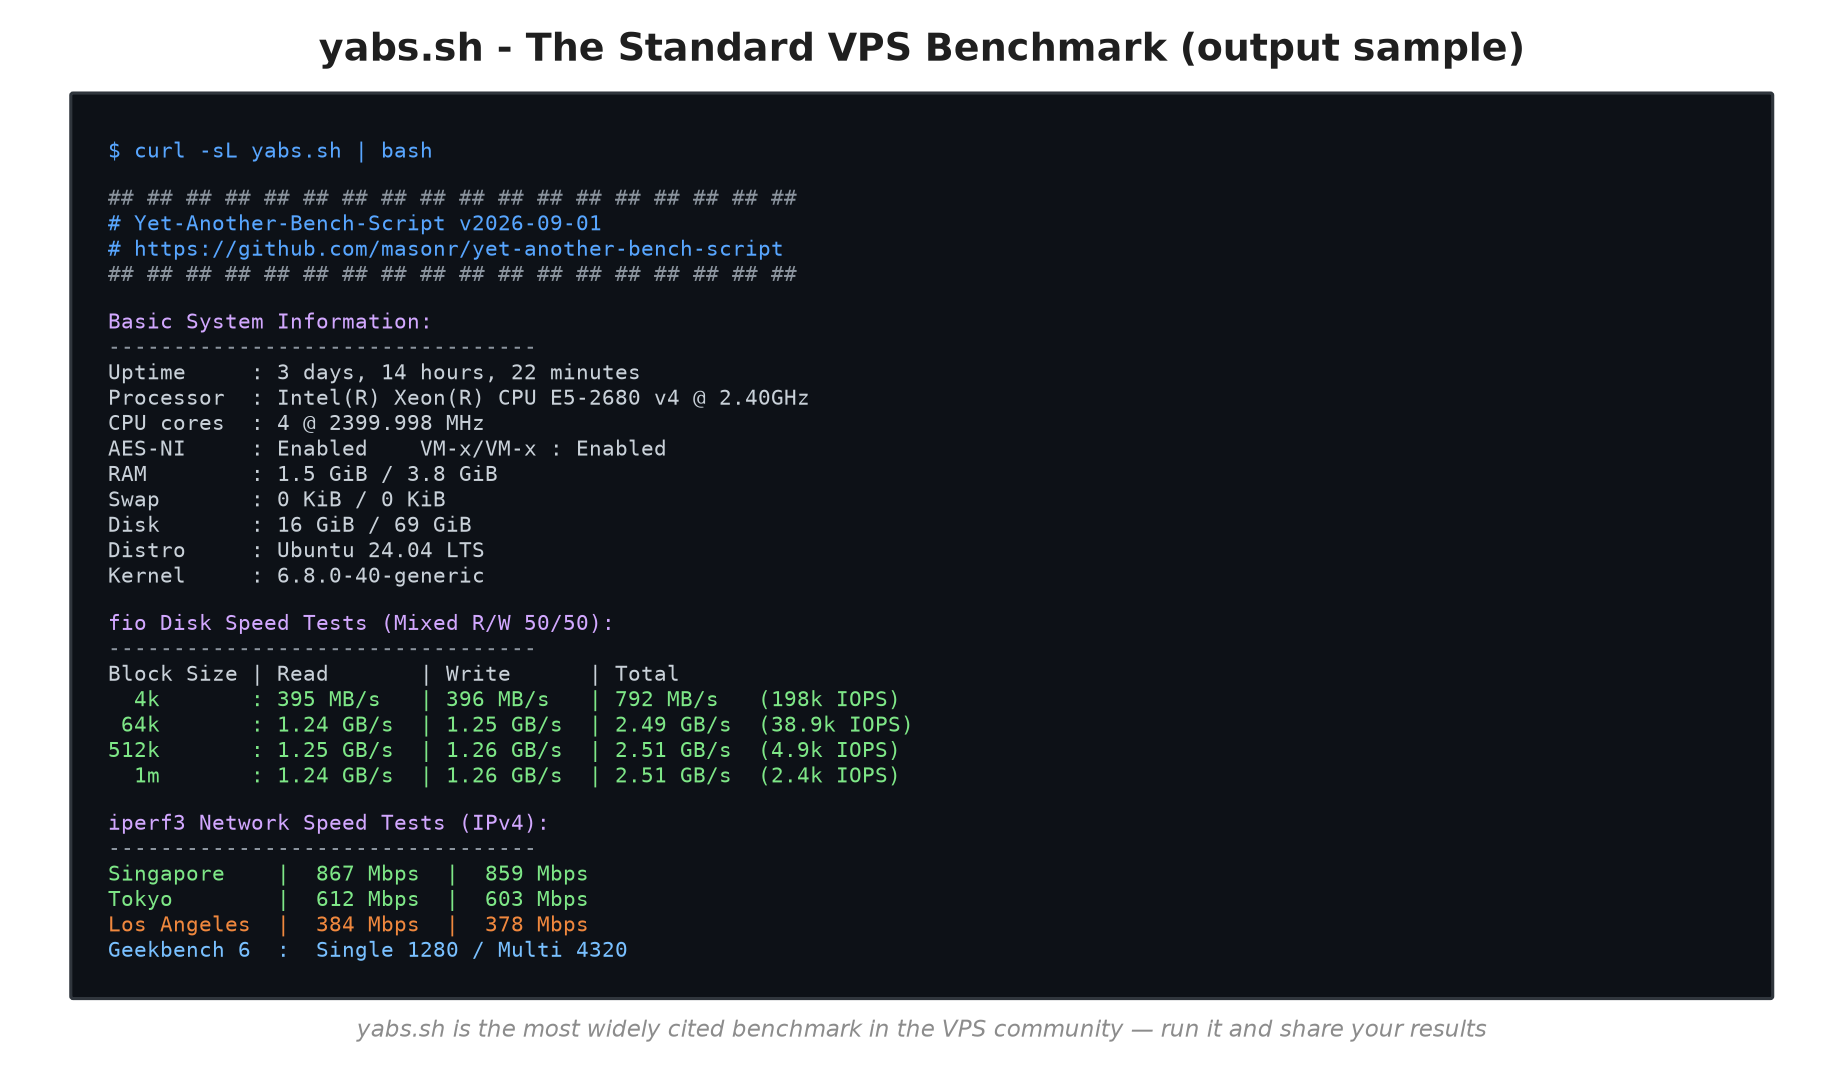
Figure 5: Sample yabs.sh output. The script is the de facto standard on LowEndTalk, r/selfhosted and WebHostingTalk — posting your results lets the community validate (or call out) the numbers.
Why use yabs.sh? Three reasons:
- Community standard. If you post a yabs.sh output on LowEndTalk or r/selfhosted, everyone immediately understands what you ran and how to read it.
- It does the boring work. Fio with multiple block sizes, iperf to 9 locations across 3 continents, Geekbench download+run — all automated.
- It updates regularly. The maintainers keep the iperf server list and Geekbench URL current. Bookmark yabs.sh.
8. Red Flags: When Your Provider is Misleading You
After running hundreds of benchmarks across dozens of providers, we see the same red flags over and over. If you spot any of these, look elsewhere:
| Red flag | What it really means |
|---|---|
| CPU steal consistently > 5% | Host is overcommitted. Your vCPU is waiting on other tenants. |
| 4K random write | Either HDD-backed storage (despite "SSD" label) or severely oversold IOPS. |
| Ping looks great first 10s, then packet loss | Traffic shaping: you get priority on burst but sustained traffic is deprioritized. |
| iperf3 drops after 60 seconds | Port speed throttling after a burst allowance. You are not getting 1 Gbps sustained. |
| Disk speed drops 50%+ after 5 minutes | Small SSD cache in front of HDD (common on "SSD cached" marketing). |
| Geekbench single-core | Old or severely throttled CPU; will feel slow for web/database workloads. |
| Geekbench multi-core is not 2x/4x single-core | Oversubscribed cores. The provider is selling more vCPUs than physical cores available. |
| MTR shows loss at the first hop | Provider's network is congested at their own edge, not an upstream issue. |
| They refuse to let you benchmark | Run. Legitimate providers have nothing to hide. |
9. Your 7-Step Benchmark Workflow
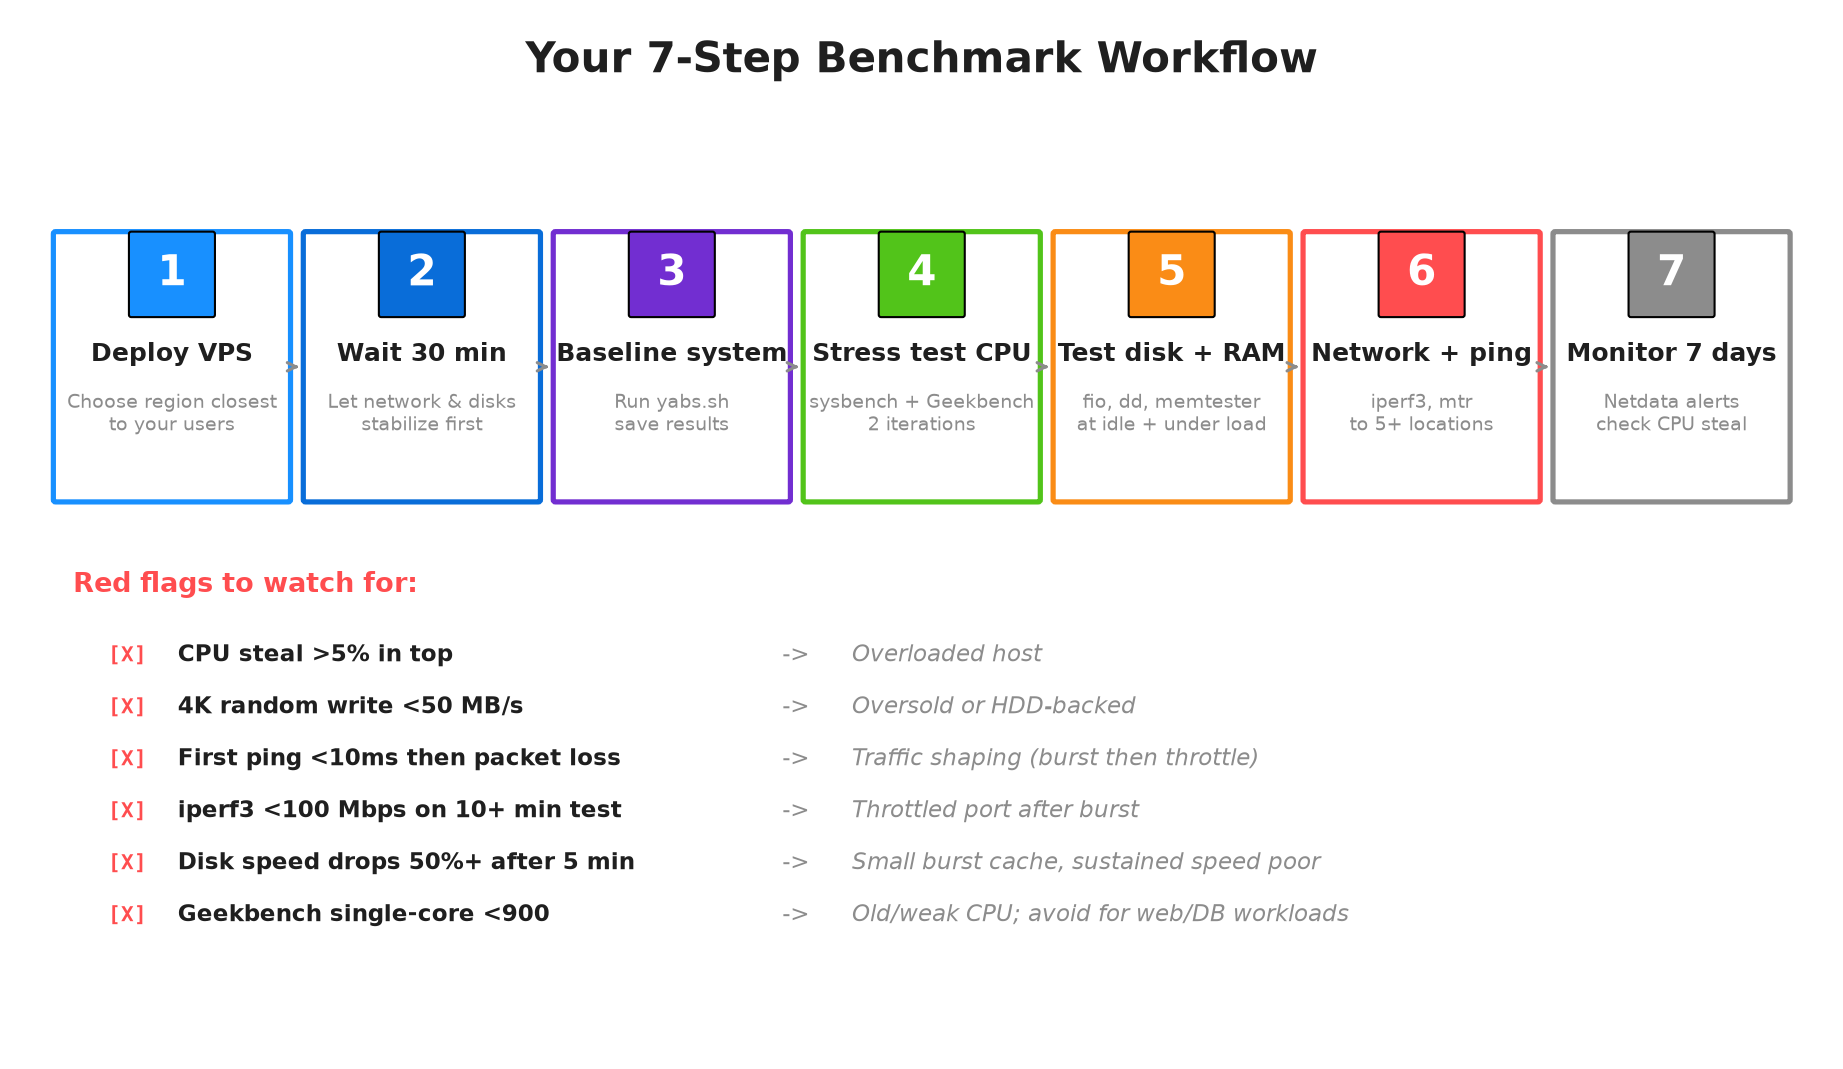
Figure 6: The repeatable 7-step workflow we recommend for every new VPS deployment.
- Deploy the VPS in the region closest to your users (use our VPS location guide if unsure). Choose a plan with enough RAM — RAM starvation kills performance faster than weak CPU.
- Wait 30 minutes. Go make coffee. Let cloud-init finish, let the storage sync, let the hypervisor settle.
- Run yabs.sh first and save the output to a file. This is your baseline. If numbers look bad now you can cancel during the refund window instead of wasting time.
- Stress-test CPU with sysbench single+multi core and optional Geekbench. Compare multi-core scaling; it should be close to linear (2 cores ~2x single-core score).
- Test RAM and disk with fio (4K random is what matters). Run a 5+ minute fio test, not just 30 seconds, to catch burst-cache tricks.
- Test network to 5+ locations with iperf3 and mtr. Test to destinations where your users actually are — a VPS with 900 Mbps to Singapore does not help if your audience is in Germany.
- Monitor for 7 days with Netdata or Uptime Kuma (see our VPS monitoring guide). Watch for CPU steal spikes, disk latency increases, and nightly backup windows that impact performance.
10. Share Your Results & Pick a Plan
Once you have benchmark numbers, share them. The VPS community — on LowEndTalk, r/selfhosted, WebHostingTalk — is full of experienced admins who can tell you whether your numbers are normal or you got a bad node.
At LuckVM, we publish benchmark numbers for every region and plan on our site, because we believe you have the right to see real performance data before you pay. We also offer a 24-hour refund window so you can run your own benchmarks risk-free. If your node underperforms, open a ticket and we will migrate you.
What our plans typically score
Based on our ongoing internal benchmarks (Q3 2026), our plans consistently deliver:
| Plan | Price/mo | sysbench single-core | 4K rand read | Network (intra-region) |
|---|---|---|---|---|
| Starter (1 vCPU / 2 GB / 70 GB NVMe) | $8.80 | 890–930 | 380–420 MB/s | Up to 1 Gbps |
| Standard (2 vCPU / 4 GB / 70 GB NVMe) | $26.40 | 890–930 | 380–430 MB/s | Up to 1 Gbps |
| Professional (4 vCPU / 8 GB / 70 GB NVMe) | $48.40 | 890–930 | 400–450 MB/s | Up to 1 Gbps |
| Enterprise (8 vCPU / 16 GB / 70 GB NVMe) | $81.40 | 890–940 | 420–480 MB/s | Up to 1 Gbps |
Prices are as of September 2026; check our pricing page for current numbers. Hong Kong and Los Angeles start at $8.80/month; Singapore, Tokyo and Frankfurt start at $11/month.
Frequently Asked Questions
What is the best VPS benchmark script in 2026?
yabs.sh (Yet-Another-Bench-Script) by Mason Rowe is the community-standard all-in-one benchmark covering CPU, disk I/O with fio, and network iperf3 tests to multiple regions. One command gives you a complete picture that is instantly recognizable on LowEndTalk, r/selfhosted and WebHostingTalk.
How long should I wait after deploying a VPS before benchmarking?
Wait at least 30 minutes after provisioning. Hypervisors and storage controllers often perform initial sync operations right after boot, and cloud-init may still be installing packages in the background. Benchmarking during this window produces misleadingly low numbers.
What is a good 4K random disk IO for a VPS?
On NVMe storage you should see 300+ MB/s (75,000+ IOPS) for 4K random reads/writes. SATA SSD typically gives 100–200 MB/s. Anything below 50 MB/s on 4K random is suspicious and usually indicates HDD-backed or severely oversold storage.
How do I detect CPU steal on a VPS?
Run top or vmstat 1 and look for the 'st' (steal) column. Consistently over 5% steal means the host is overcommitted and your vCPU is waiting for physical CPU time. Anything over 15% sustained is unacceptable and you should ask for a migration or refund.
Should I trust the provider's advertised bandwidth?
Never. Always verify with iperf3 over at least 5–10 minutes (not 10 seconds). Many providers advertise 1 Gbps but deliver 100–300 Mbps sustained, or throttle after a short burst. Test to multiple geographically distributed servers where your users are.
Is Geekbench a reliable VPS benchmark?
Geekbench 6 single-core scores are a decent CPU comparison metric (1100+ is good, 1500+ is excellent), but multi-core scores can be gamed by providers that burst CPU for short periods. Always combine Geekbench with sysbench cpu and real-world workload testing for a complete picture.
How often should I re-benchmark my VPS?
Run the full benchmark suite immediately after deployment, then a quick sanity check monthly. Run full yabs.sh after any major provider maintenance or if you notice performance degradation. Always save your initial results as a baseline — they are your evidence if performance drifts.
Is it okay to benchmark on a production VPS?
Light benchmarks (ping, iperf3, basic dd read test) are fine on production. Heavy fio writes and stress-ng will saturate disk I/O and CPU, causing service disruptions. Run heavy benchmarks during low-traffic windows, on a staging clone, or during initial deployment before you go live.
Deploy a VPS you can actually benchmark
Spin up a LuckVM NVMe VPS in Hong Kong, Los Angeles, Singapore, Tokyo or Frankfurt. Provisioning takes 5–10 minutes, and our 24-hour refund window lets you run your own benchmarks risk-free.
View Plans & Pricing →